Monitoring
MetalPipe lets you easily monitor your pipeline, identify bottlenecks, and help diagnose failures.
Logging table
While a pipeline is being executed, a table of information will periodically be logged (at the INFO logging level). Each row provide diagnostic information about a single node in the pipeline. This is a typical example:
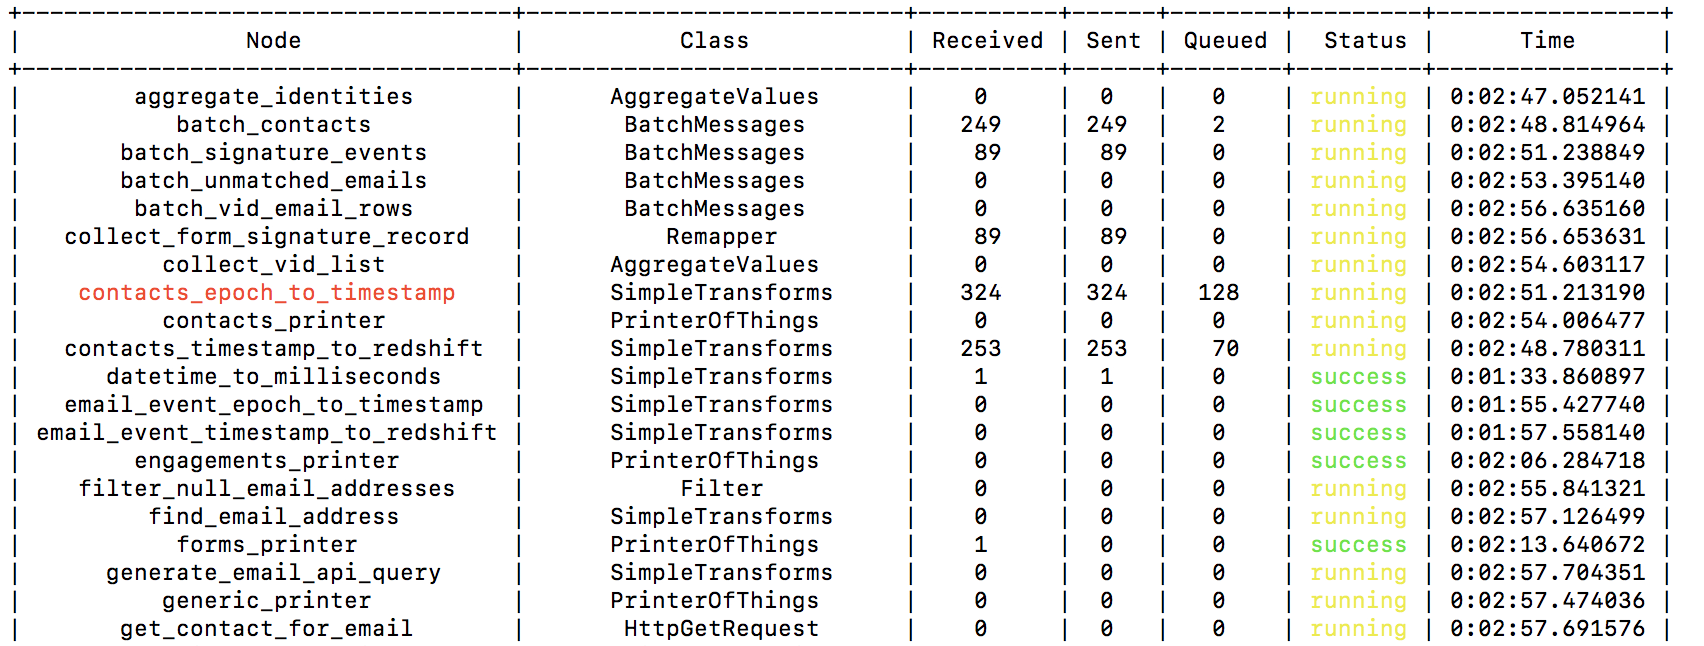
The logging table provides information about each node in a running pipeline.
We’ll go through each column of the table.
The Node column contains the name of a node. This is the name that was
given in the configuration file as a top-level key in the nodes section.
If the name is printed in red (as in contacts_epoch_to_timestamp in the
example), then the node is a “bottleneck”. In order to identify bottlenecks,
MetalPipe periodically polls each node to determine if (1) it input queue is
full and (2) its output queue is not full. If those conditions are frequently
met, then the node is identified as a bottleneck.
Note that being a bottleneck is not necessarily a sign of inefficiency. For any sufficiently long-running pipeline, it is very likely that some node will happen to be the slowest, and it will be considered a bottleneck.
The Class column simply gives the class of the MetalNode object, which
tells you what function it is performing.
The Received, Sent, and Queued columns tell you how many messages
are at various stages of processing. The Received number indicate how
many messages have been procesed by the node, including any message that is
currently being procesed. Sent gives how many messages have been output
by this node. Finally, Queued is the number of messages that are on that
nodes incoming queue(s). If there are several incoming queues, then this number
is the sum. Note that for a source node, the value of Received will always
be zero, and for any sink node, the value of Sent will be zero.
The Status column has three possible values: running, success,
and error. Here, success means that the node has completed its work
and has terminated without raising an error. A node is considered to be
done with its work when its parent nodes (if any) have completed, its incoming
queues are all empty, and it is not processing any messages. An error is
indicated whenever a node raises an Exception. When this happens, the entire
pipeline is shut down automatically. These status messages are colored yellow,
green, and red respectively.
Finally Time is the total amount of time the node has spent running. When
it is in a non-running state (either success or error), the clock stops.